
Overview
Cisco Spaces processes data in different ways based on context. This article will demonstrate how data is interpreted and calculated for different apps within Cisco Spaces.
Spaces Applications
Right Now
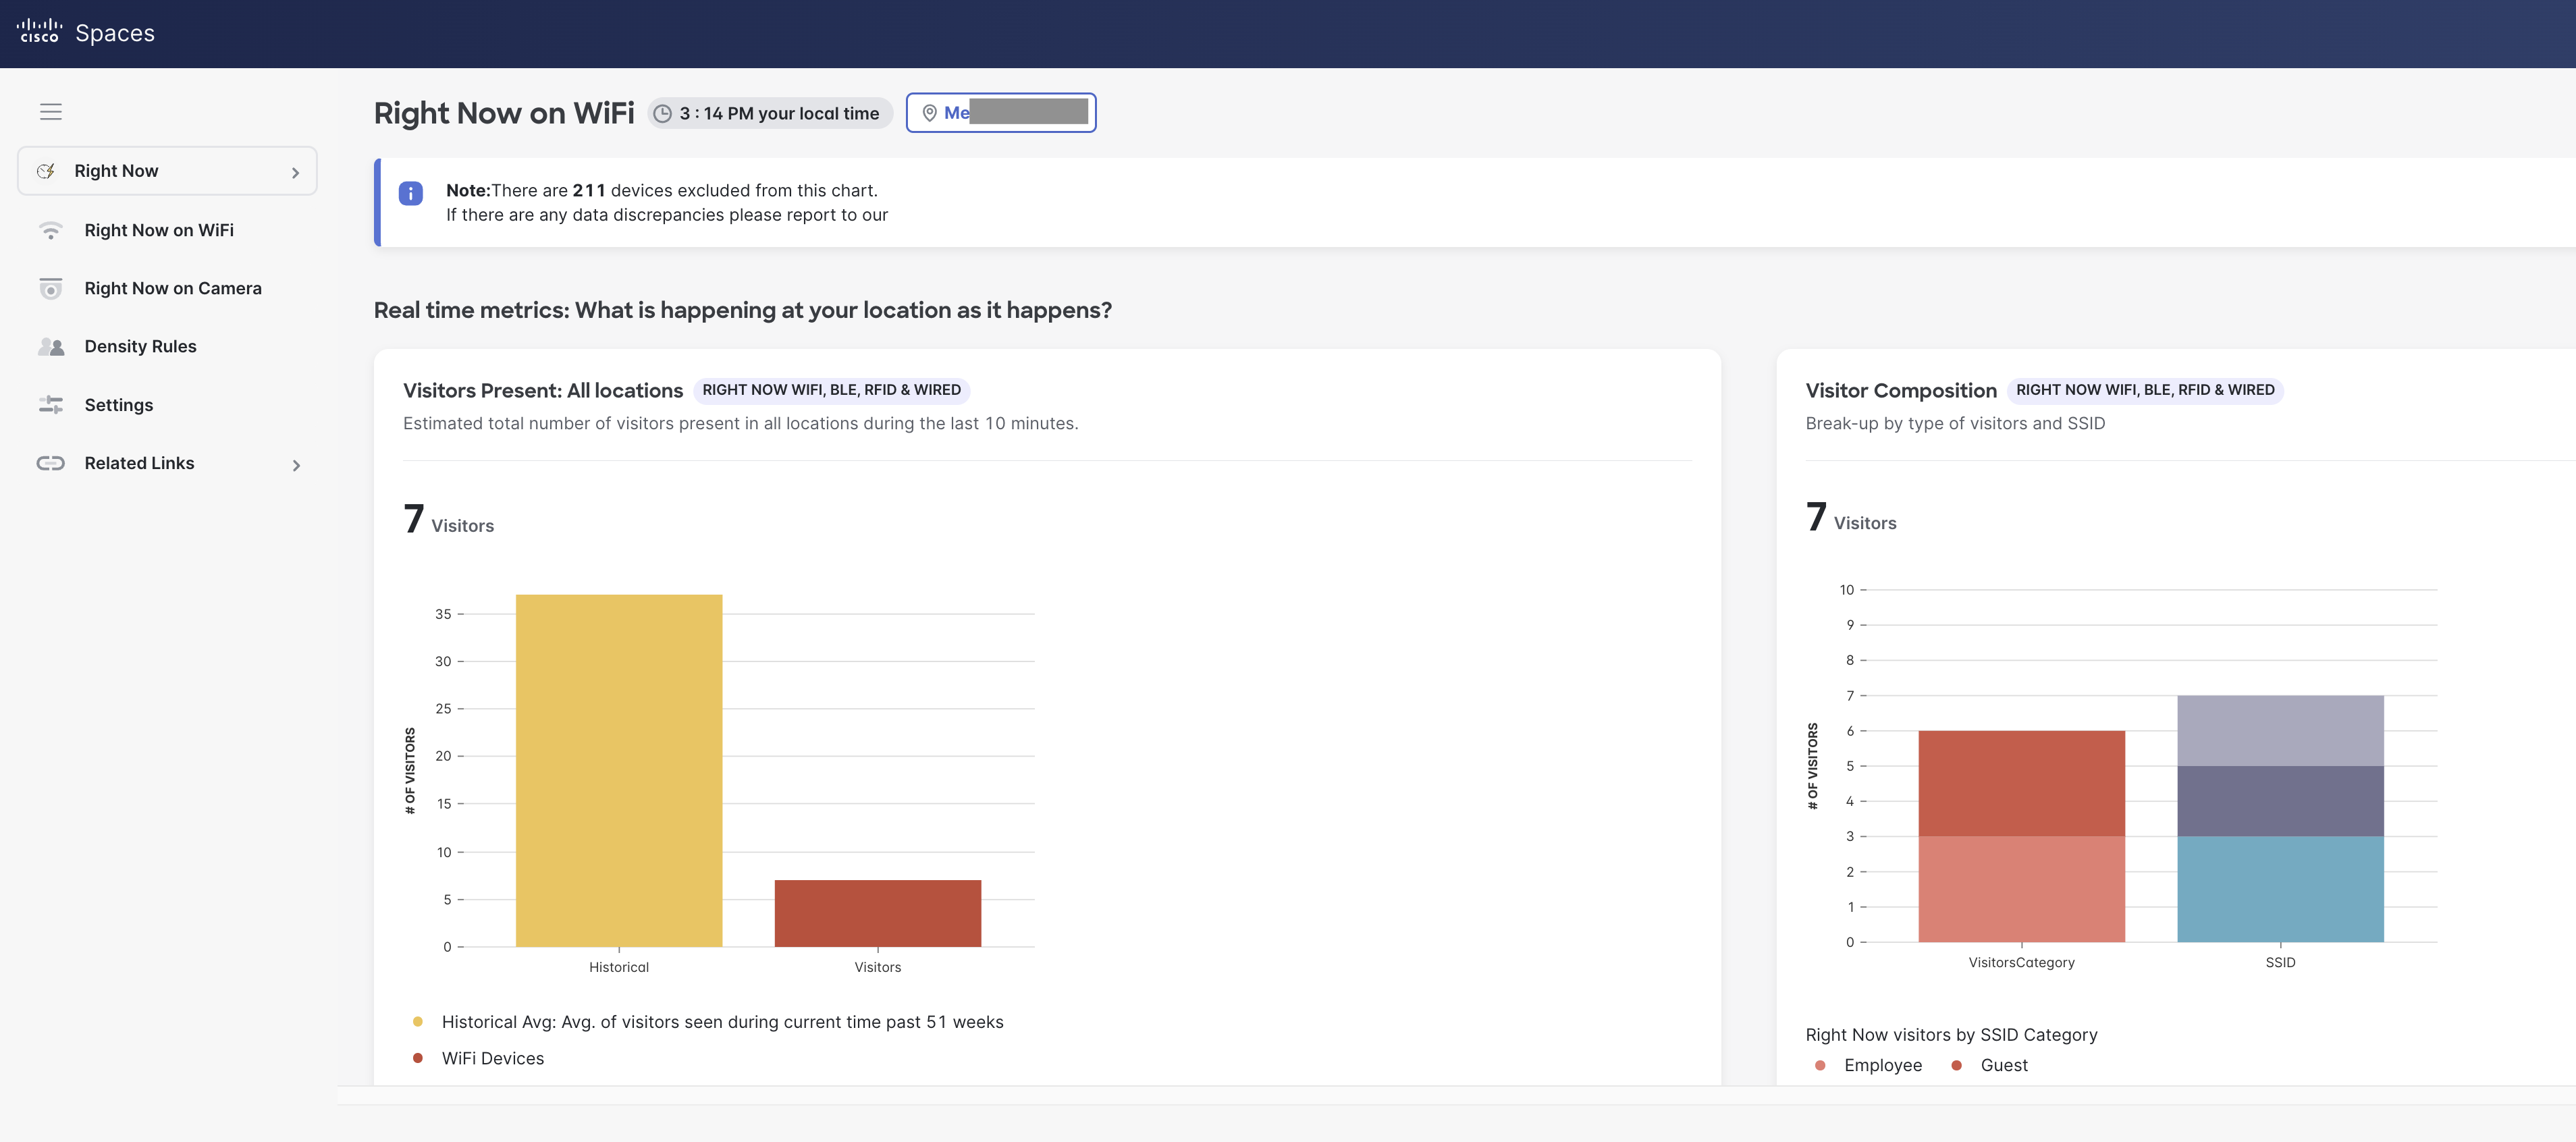
The Right Now app allows for real time count of the number of people within your locations. It provides a real time count of the number of people within a physical space & how that compares with the historical average.
-
Visitors are defined as counts of unique (Wi-Fi associated) user-ids that are present at a target location during the past 10 mins. This means that when mac addresses share the same user-ids they are counted as one visitor (deduplicated).
-
Also, there are configuration filters in the app to allow/remove certain SSIDs in the counts
-
The average value for the last 51 weeks is shown as historical data for each chart in the report.
-
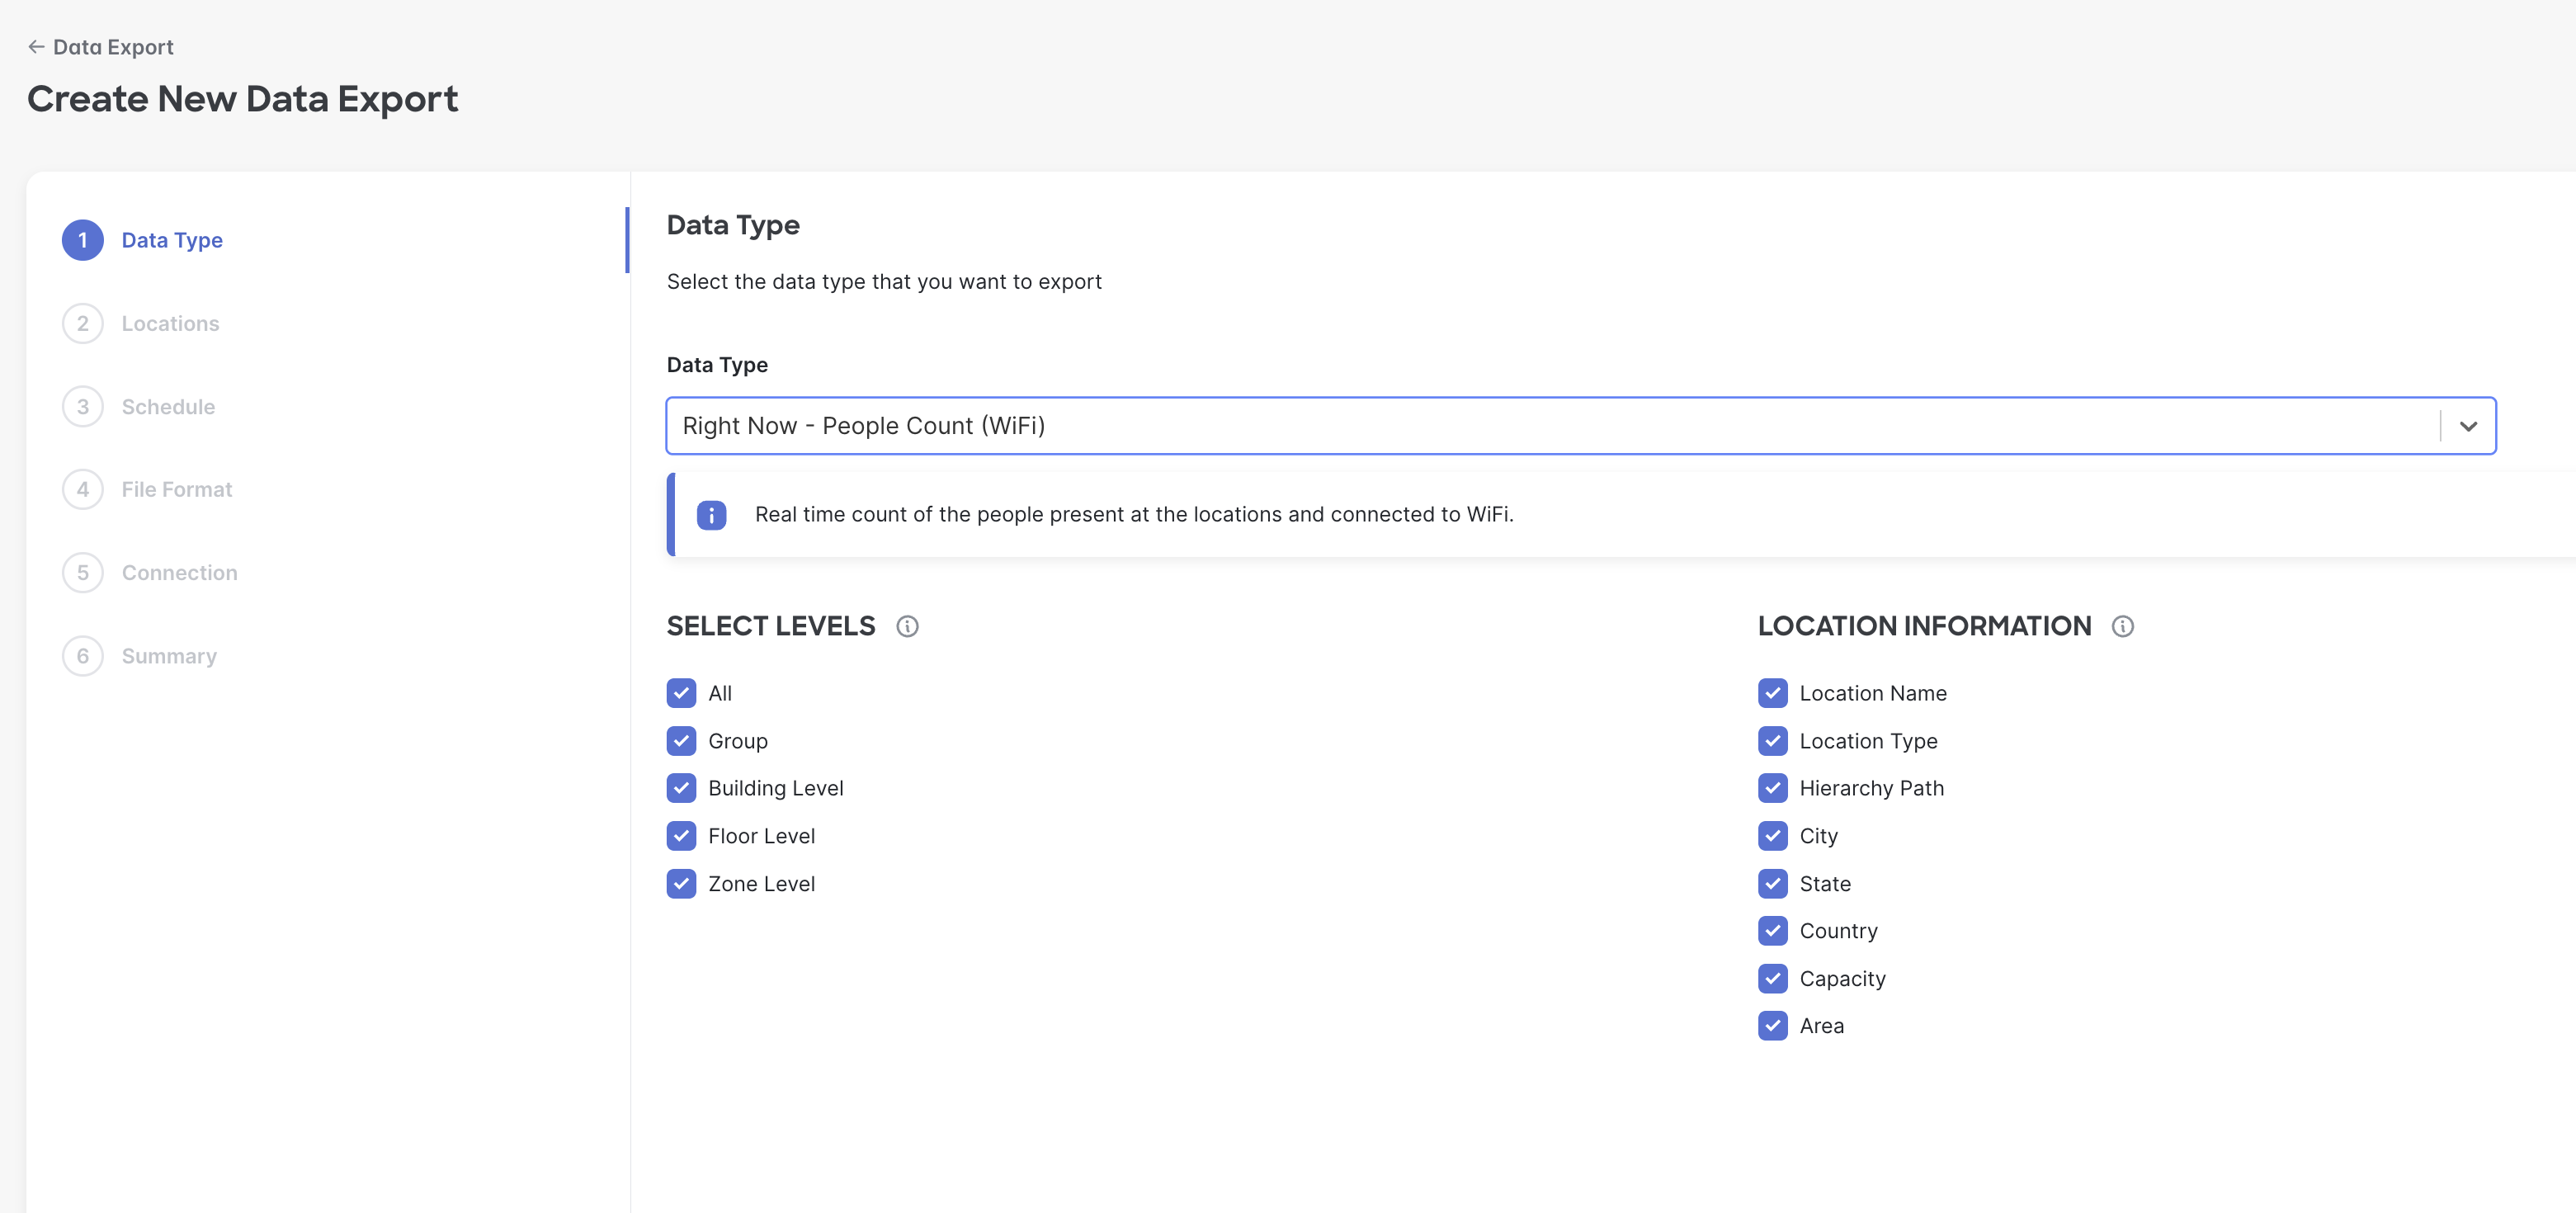
Historical minute-wise counts from Right Now can be exported through the Data Export feature (Setup>Data Export> Create new export> choose ‘Right Now’ option.
Behaviour Metrics
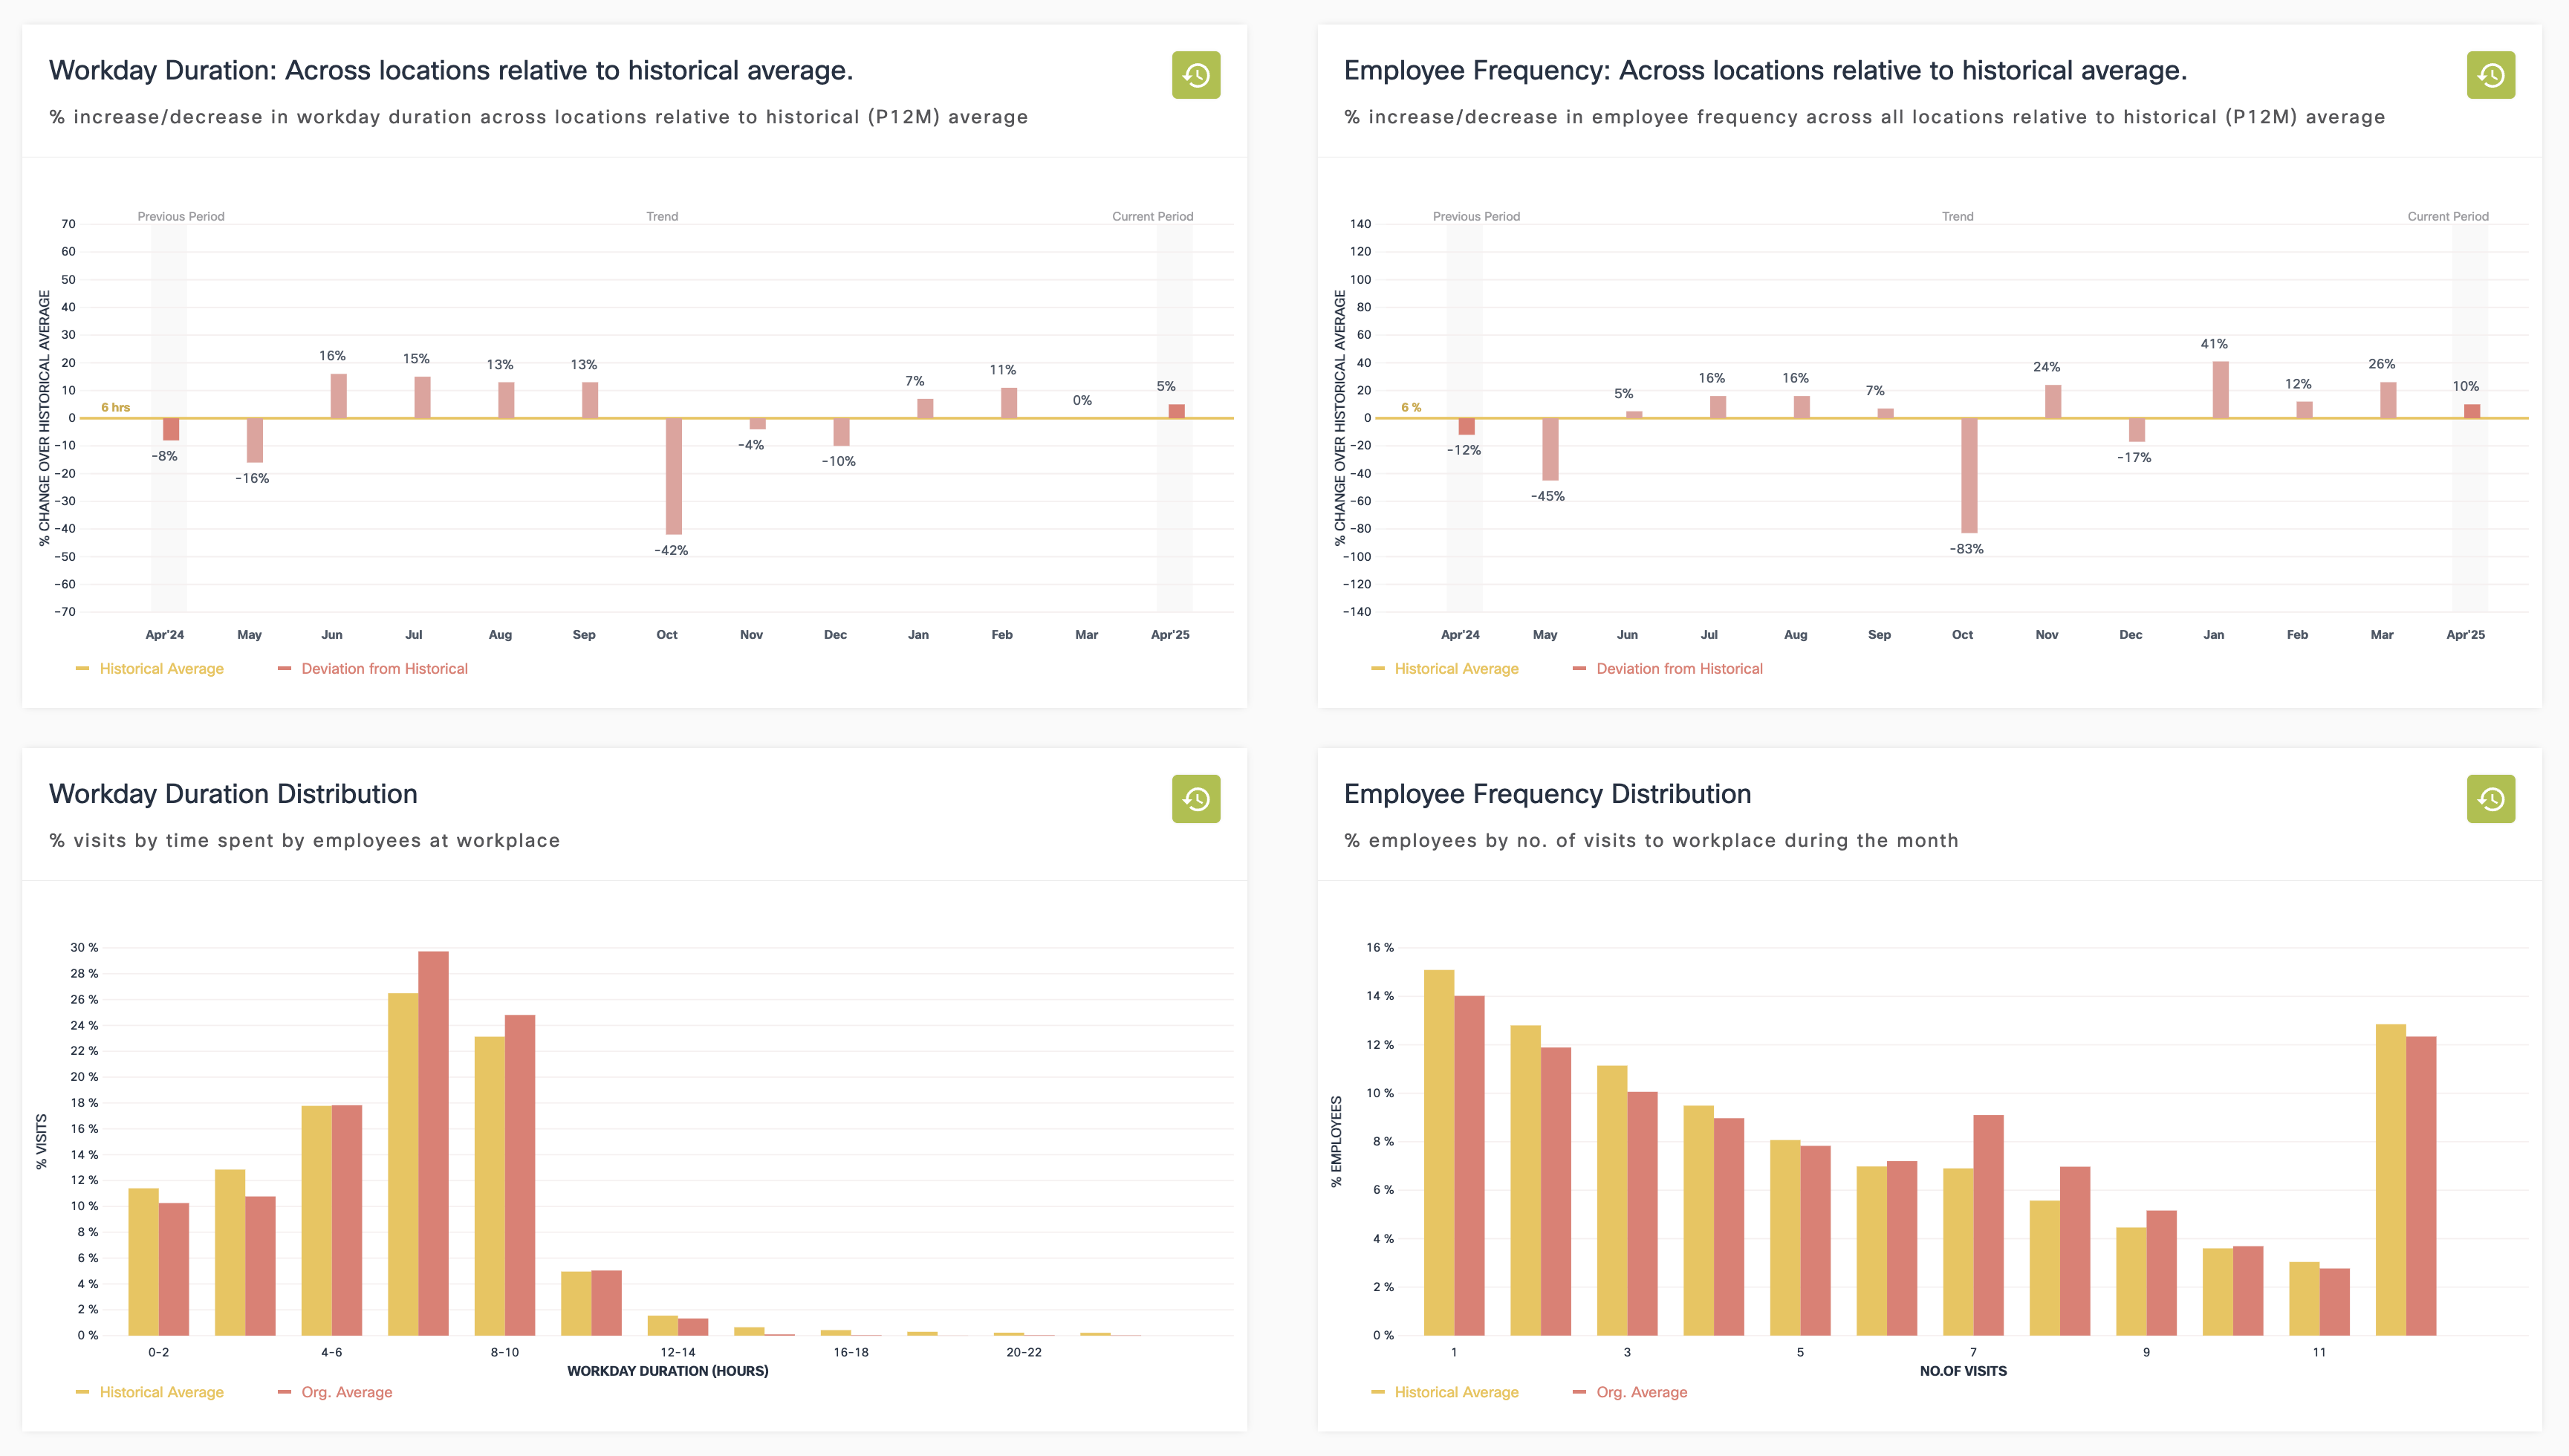
Behaviour Metrics provides data around people behaviour within locations - e.g. Buildings, floors, zones etc.
-
Primarily metrics include Visit Duration (dwell time) and Visit Frequency (how often a person visits a location)
-
Behaviour metrics has vertical specific versions for Retail, Workspace and Education customers and a Generic version for others.
-
Retail focuses on measuring behaviour of guests and this involves excluding employee devices from the computation. The employee devices are segregated through an ML based algorithm.
-
Workspace and Education metrics involve using SSID filters to separate employees/students from guests. Employee/Student metrics are derived by using dot1x authentication to dedupe those with multiple devices.
-
Visit classification (to a location) also varies across verticals. It requires an ‘idle time’ of three hours before a visit is terminated in the case of retail and 10 hours for Workspace and Education.
Space Utilization
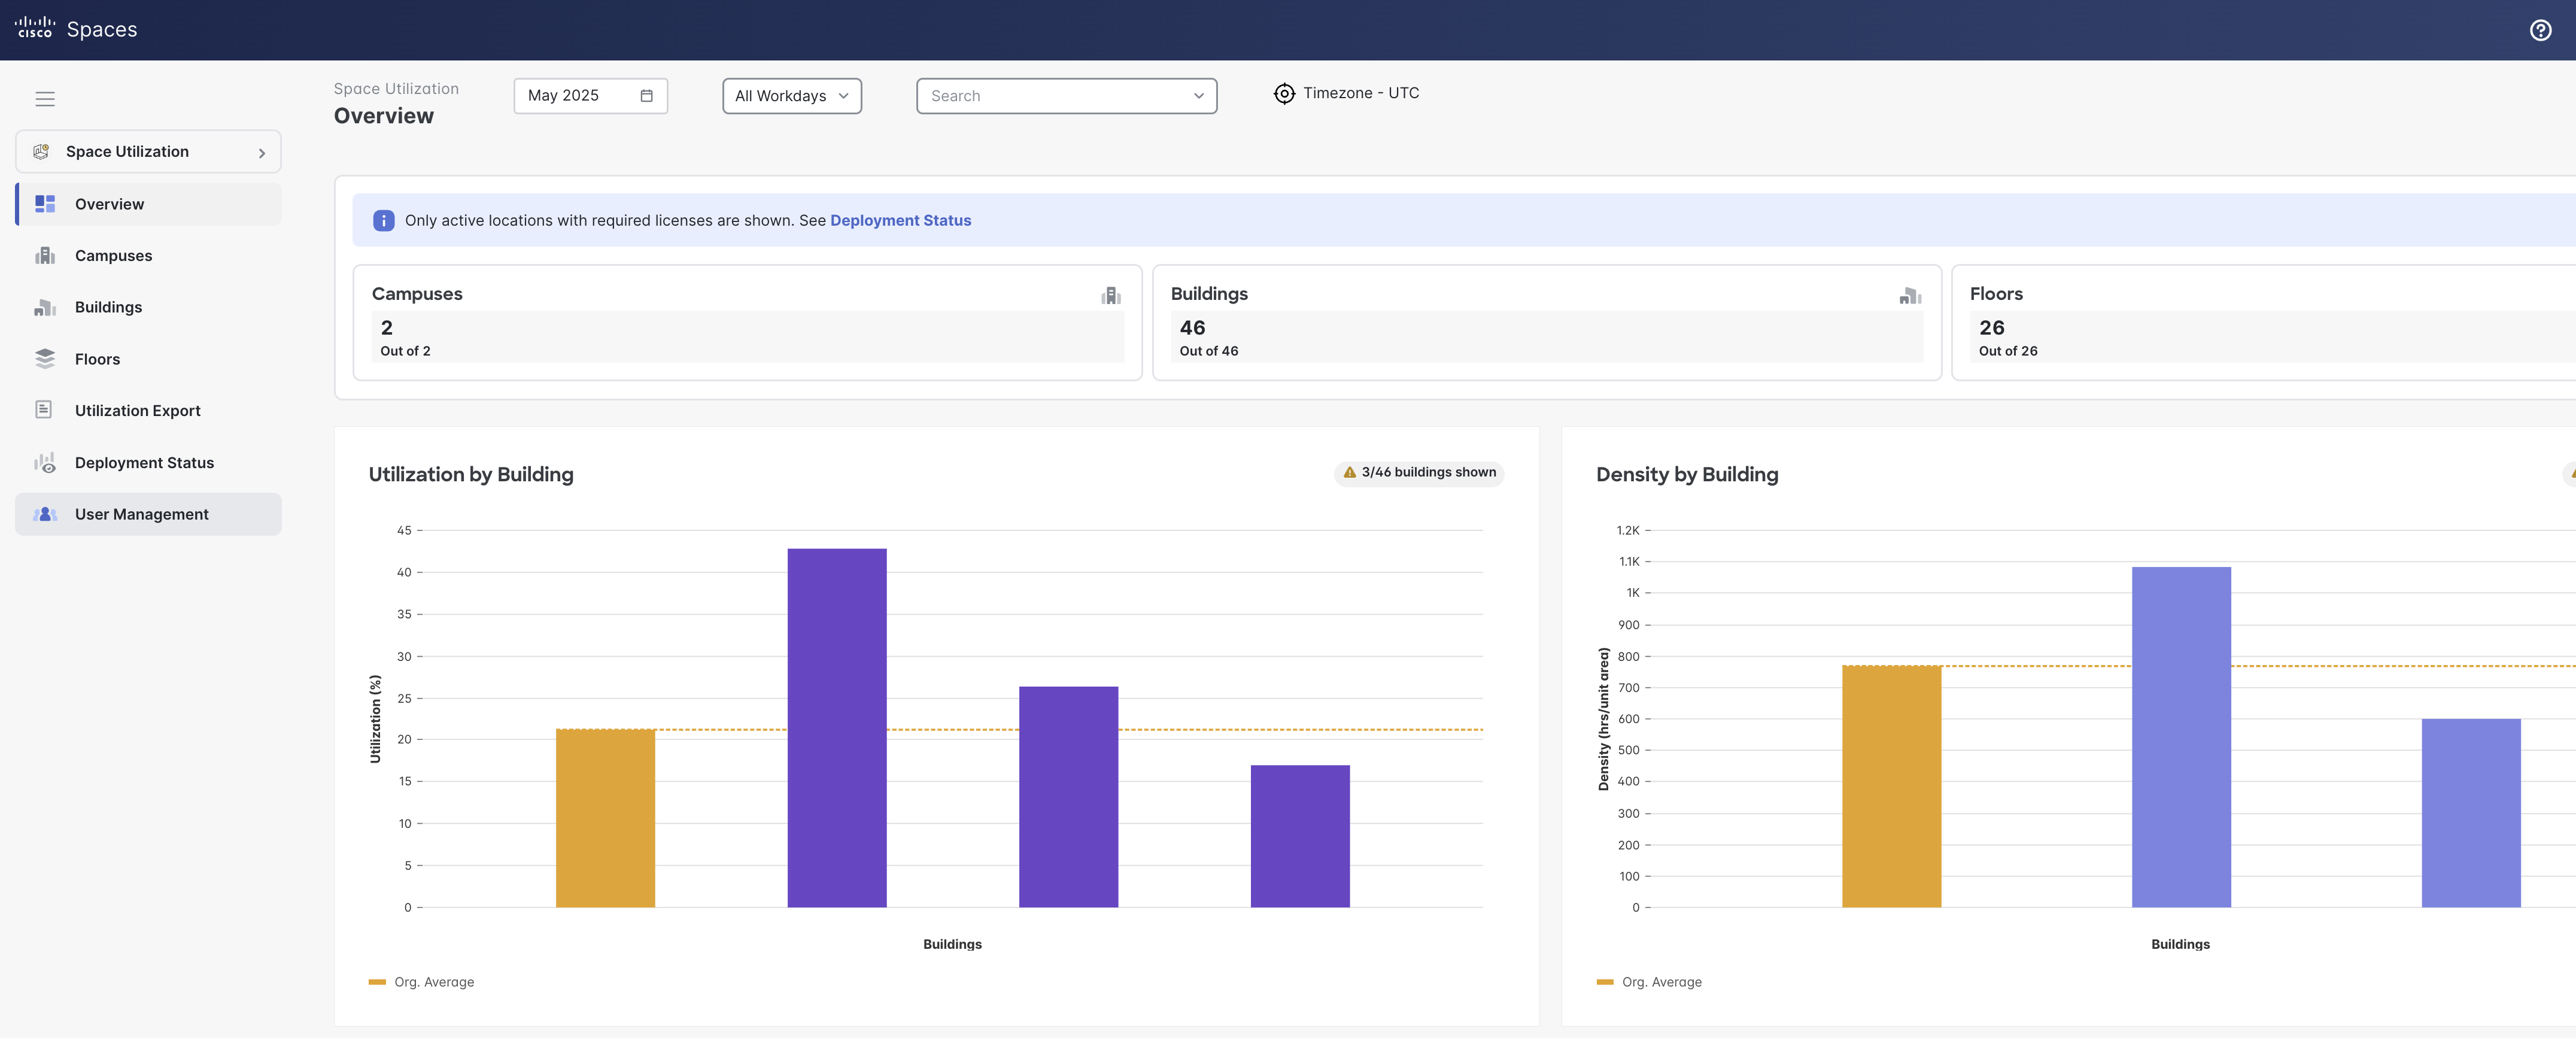
Space Utilization allows occupancy insights of buildings and floors. It allows organizations to optimize space, cut costs and streamline operations. It counts people within specific locations (orgs, buildings, floors, zones and rooms).
-
It uses wifi to compute occupancy/utilization of buildings and floors, and sensors (Cisco video endpoints, Portal Beam, Thingsee and Moko) for rooms
-
People counting also de-duplicates people with multiple devices. The utilization counts are based on unique (Wifi associated) user-ids. This means that when mac addresses share the same user-ids they are counted as one visitor (deduplicated).
-
The SSIDs excluded in the Right Now App configuration are applied here as well.
-
The utilization percent are based off of the configured max building/floor capacity in the location hierarchy.
-
Data is broken down at a daily level.
Location Analytics
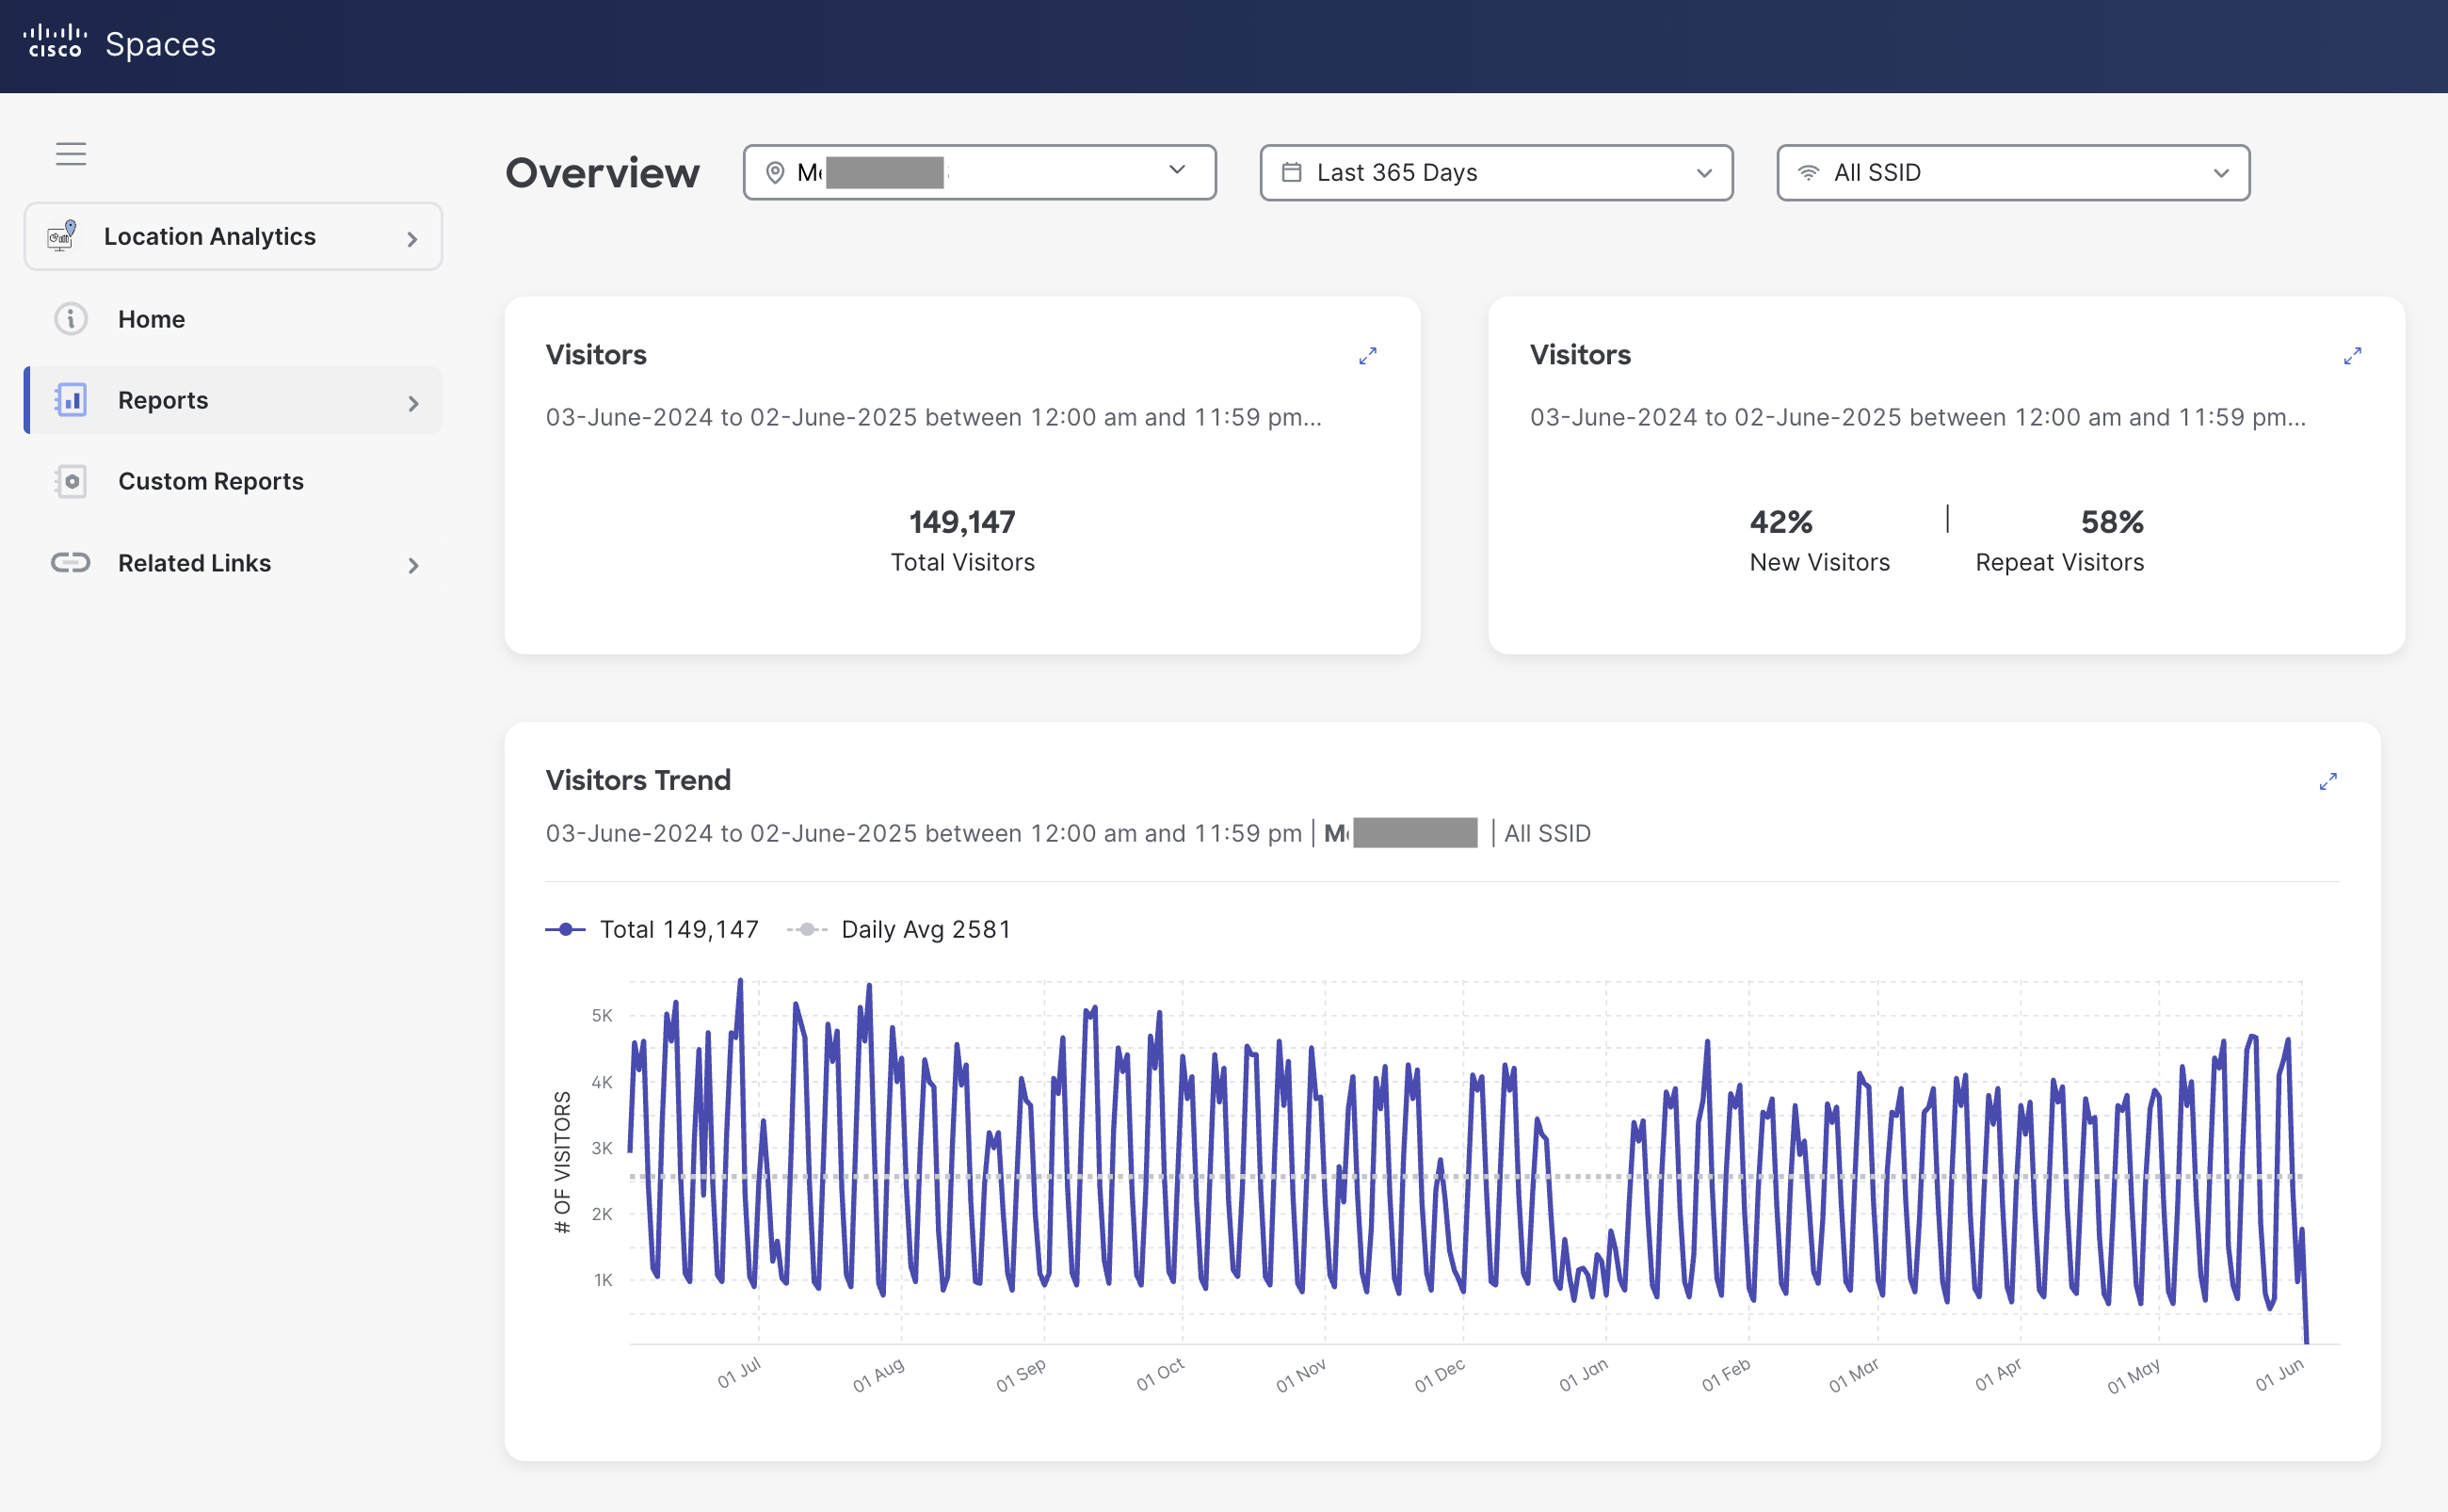
Location Analytics is an app that counts associated devices. It enables you to create various reports related to the no. of ‘visitors and visits’ to your locations. You can create custom widgets by filtering data based on location, date range or SSIDs and get a granular view of location behaviors.
-
Visitors are defined as counts of mac addresses regardless if they share the same user-ids. No deduplication is applied.
-
Devices connected less than 5 mins or greater than 12 hours are excluded.
-
Data can be broken down by SSID, Building, Floor and Zone and time ranges are customizable and is available across the life of the Spaces tenant.
Detect and Locate
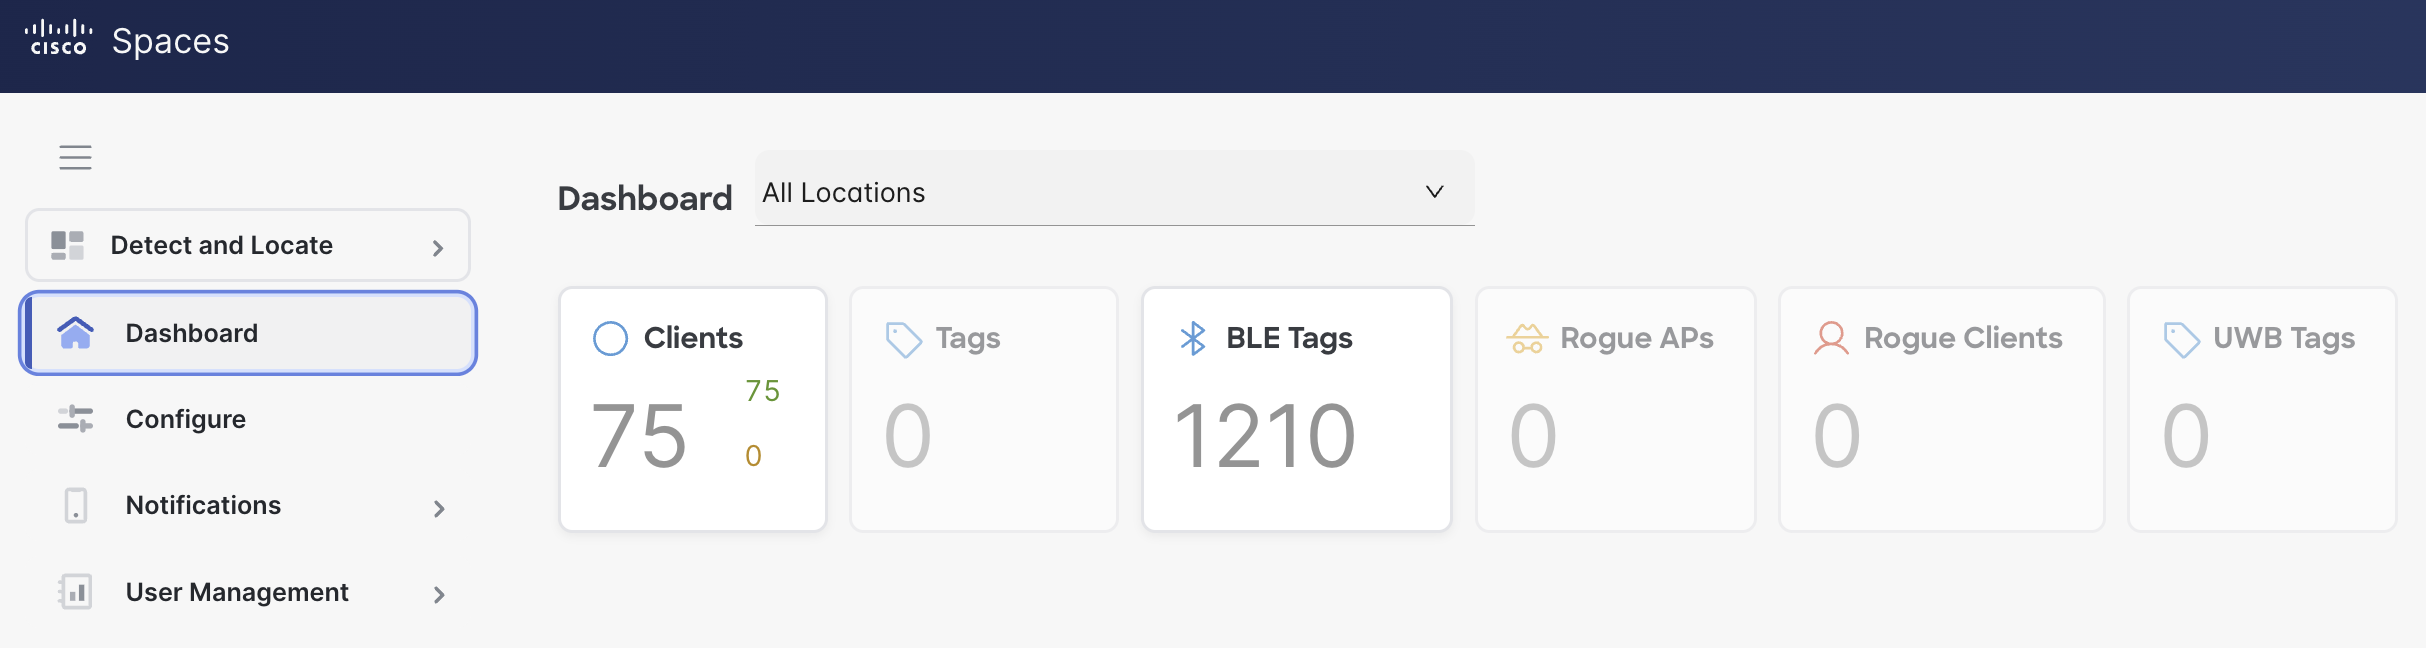
Detect and Locate is an application that allows users to determine the location of devices as detected by their Access Points. It allows you to track and locate any device connected to your network. The most common type of devices are Wi-Fi clients, but the application can also detect the location of ‘Wi-Fi RFID tags’, ‘rogue APs’ and ‘rogue clients’.
-
Clients are defined as counts of mac addresses regardless if they share the same user-ids. No deduplication is applied.
-
Only non-randomized probing counts of clients are displayed (in red). For all intents and purposes, the probing data does not represent approximate count of people in the space due to aggressiveness of randomization.
-
Historical data playback is up to 30 days.
Reference