Background
Accurate network map geo-coordinates ensure anything on the network (including the network APs themselves) or tracked by the network (e.g. asset tags) are properly assigned latitude and longitude with respect to a world map. Errors in network map placement, scaling, and alignment can result in margins of error measured in feet up to miles depending on the severity of incorrect geo-coordinates. Ultimately, this can result in poor performance in indoor wayfinding, asset tracking, WiFi client trilateration, etc. For example, heat maps of building occupants can appear outside buildings boundaries. To ensure the best outcomes, placement of network maps and APs relative to those maps is essential.
There are multiple ways to solve network map placement issues and new methods in the product development pipeline. This document will be updated to account for these methods over time, but it was last updated in December 2025.
The preferred approach is to use the Cisco Spaces > Network Map Calibration - RECOMMENDED method.
Network Map Margins
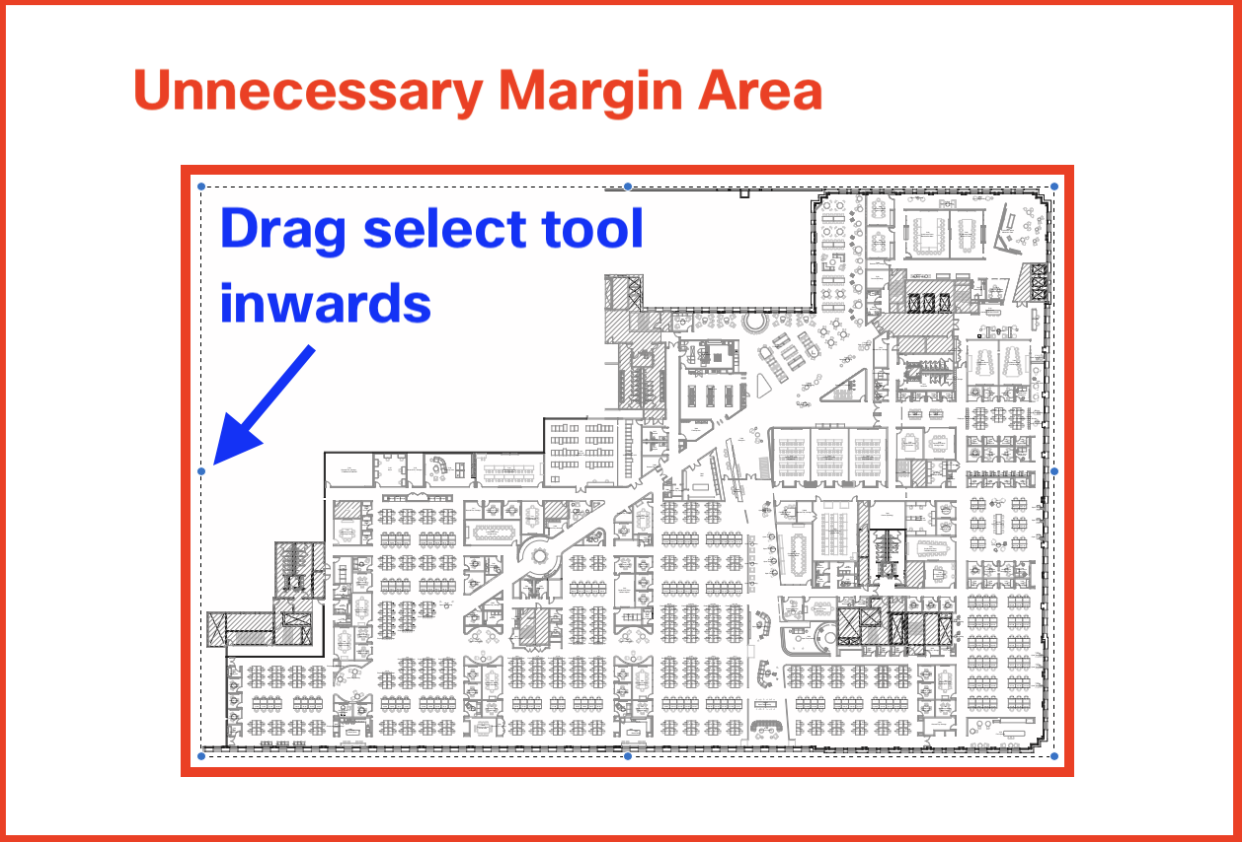
Making sure WiFi clients, for example, are confined to a building’s boundaries starts with a good quality network map file. Network maps with extra spacing or margin around the edges of buildings can create some extra space for client trilateration to deviate outside the boundaries of the building. A quick fix might involve opening the network map file in an image editor and trimming the extra space using a cropping tool. For example, on a Mac, you can open an image file in Preview, opening up Tools, then Rectangular Selection. By pressing ⌘ + A on the keyboard, you can select the entire image, then drag the four sides of the selection boundary to the outermost edges of the building outline. Pressing ⌘ + C, then ⌘ + N will create a new image file that you can save.
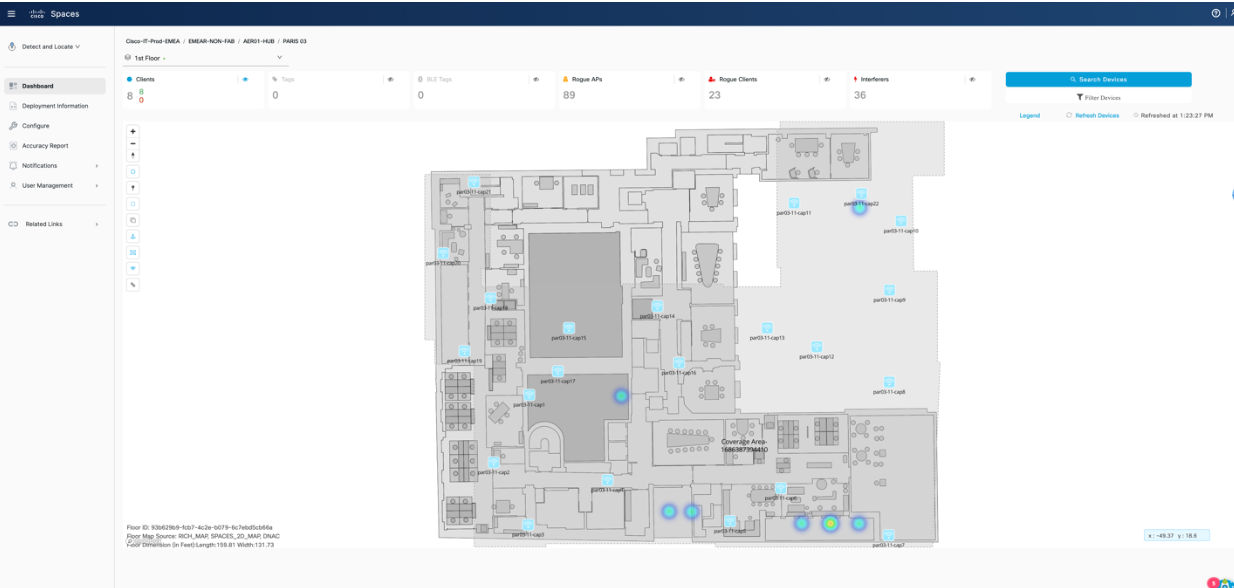
Cisco Spaces
AP Auto Placement
Set Up Access Point Auto Location
At least 4 “anchor” APs are required per floor for AP Auto Placement.
Network Map Calibration - RECOMMENDED
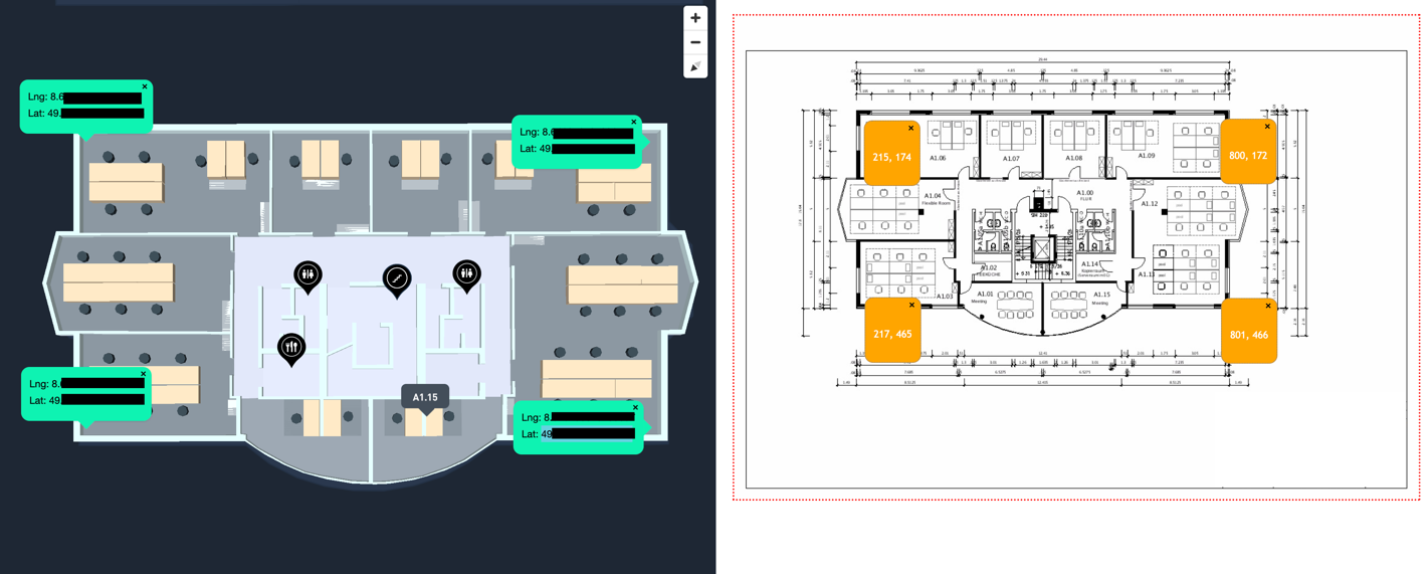
Flat floorplan image files that have been synced from Meraki Dashboard, Catalyst Center, and Prime can optionally be “calibrated” (i.e. aligned) with Digital Maps manually in Cisco Spaces Dashboard under Setup > Locations & Maps > Digital Maps > View/edit maps > Network Map Calibration.
The process involves going into each floor and in step one, moving, rotating, and scaling a transparent Digital Map on top of an image of the Network Map file. In this step, the goal is to approximately align the two maps, but precisely lining them up is not necessary in this step.
In step two, you must place at least 3 markers and precisely position them (ideally in corners that are easy to visually match up) in both the Network Map and Digital Map that correlate with the exact same position.
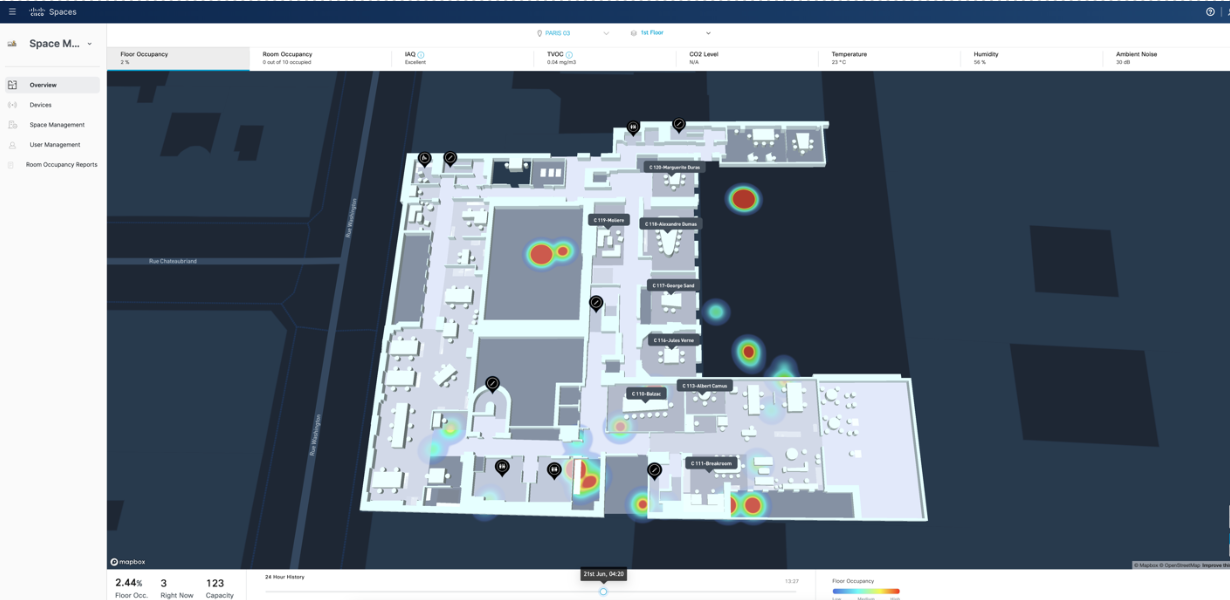
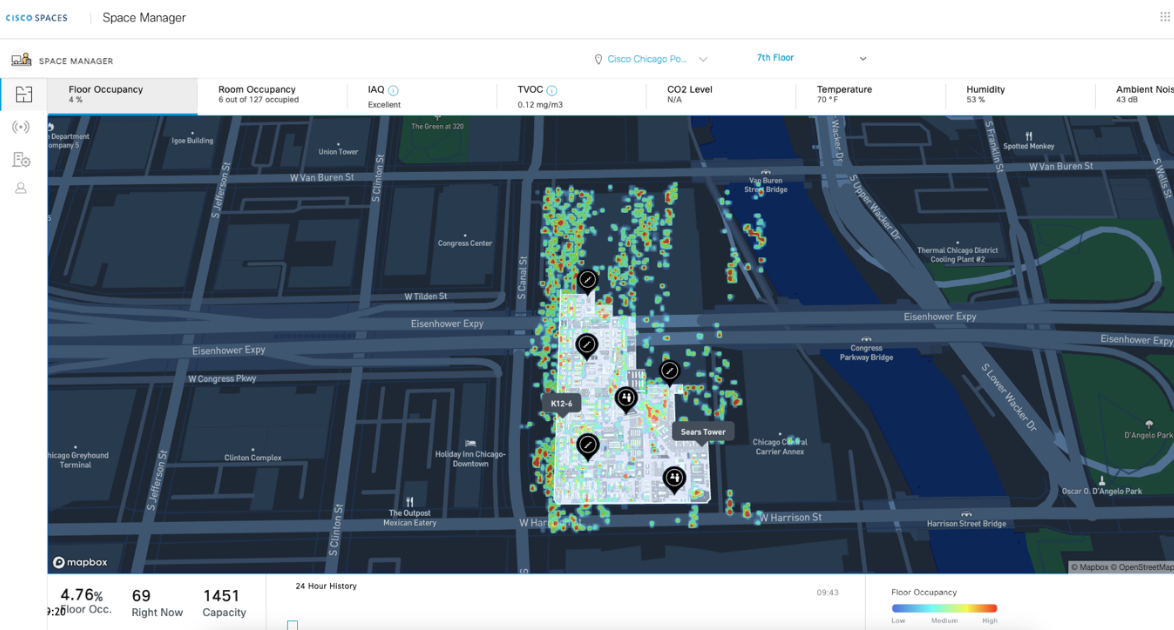
The more precise and more markers (depending on building geometry, such as square, round, or irregular polygons), the more accurate alignment will be, which will determine client location accuracy for outcomes like historical floor heat maps in Space Utilization app. However, accuracy is also determined by other major factors such as signal interference and obstructions, access point (AP) density and placement, and AP radio type (e.g. WiFi, BLE, UWB).
https://app.vidcast.io/share/5338b5db-c41c-4dac-9ad8-11edc87f07d3
Catalyst Center – Overlay Objects
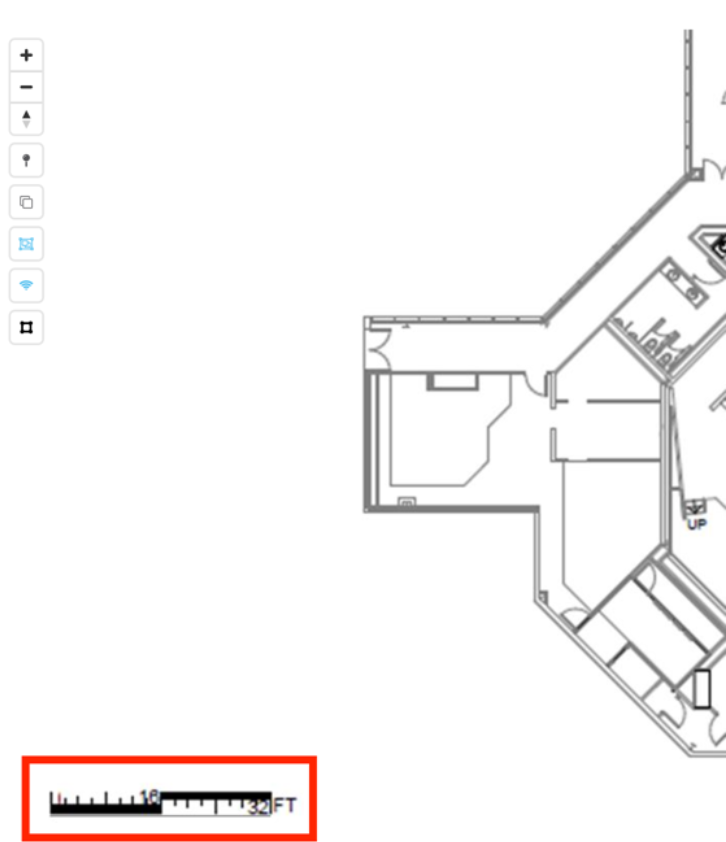
Catalyst Center – Set Scale
Work with Wireless 2D and 3D Floor Maps: 2D Map Toolbar > More > Set Scale
A correct scale measurement ensures the distance between GPS Markers and scale of the network map image align. Incorrect scale may result in “Red Pins” (see below under the Pin Colors section).
Set Scale: Change the map scale by providing a known measurement on the map:
-
Click the map to specify the starting point of the measurement.
-
Click the map again to specify the ending point of the measurement.
-
In the New line length (ft) field, enter the length of the measurement.
-
Click OK.
The floor map dimensions are recalculated based on the new measurement.
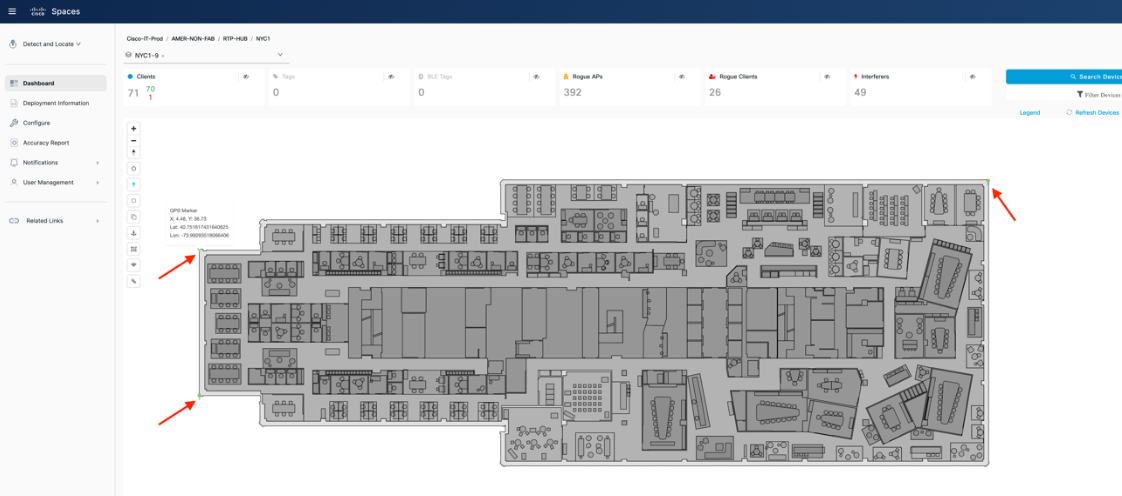
Catalyst Center – GPS Markers
Work with Wireless 2D and 3D Floor Maps: Add, Edit, and Remove GPS Markers
A minimum of 3 (ideally 4 or more depending on floor size) GPS Markers are required and each should be placed at least 20 meters apart from each other. This is to ensure proper scaling and orientation of Catalyst Center network maps when aligning with Digital Maps on Cisco Spaces, such as in Space Manager > Overview > Floor Occupancy heat maps.
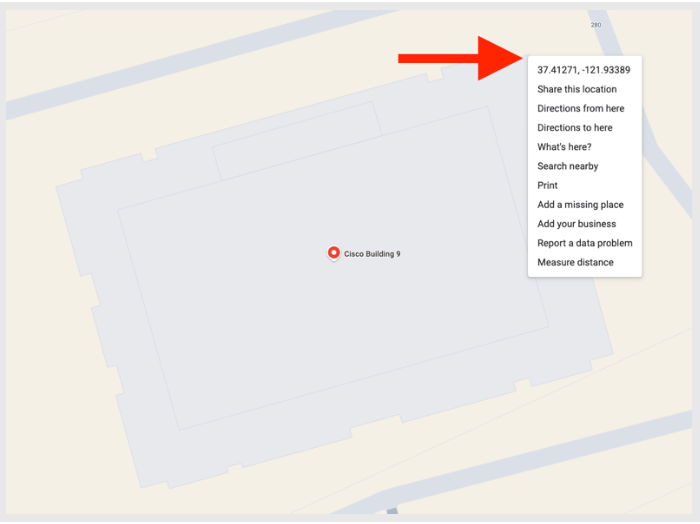
How to Obtain Latitude, Longitude for GPS Markers
Basic – Go to https://www.openstreetmap.org, search for the street address, zoom in to the corners of the building, right click, and click the latitude, longitude at the top of the pop-up. Repeat for each corner of the building, while adding GPS Markers in Catalyst Center.
Advanced – If you want more precise GPS Markers to more perfectly align the Catalyst Center network map with the Digital Maps Pro, you can open a Cisco Spaces Support case in the Cisco Spaces Dashboard and request GPS Marker latitude, longitude values with a screenshot of where to place them on the network map.
Roadmap – Cisco Spaces will be geo-referencing network maps at the time of uploading CAD files in order to automatically and perfectly align both maps for a seamless and scalable experience.
Pin Colors
Green Pins – Cisco Spaces map service applies logic to the GPS Marker positions relative to each other across floors to ensure consistency and has determined they are relatively correct, but they can still be off technically.
Red Pins – Cisco Spaces map service’s logic has determined that the GPS Markers are mostly likely incorrect and will lead to inaccurate client location data relative to a world map and geo-coordinates. Therefore, clients heat map data will not show in Space Manager > Overview and other Cisco Spaces apps that require geo-alignment. Please correct the GPS Markers to be more consistent between floors.
Catalyst Center – Coverage Areas
2D Floor Map Devices and Overlay Objects
Add, Edit, and Remove Coverage Areas
If a Coverage Area appears rotated or out of alignment with the network map, then client location will be skewed relative to the Cisco Spaces Digital Map even if GPS Markers are accurate.
Meraki Dashboard – Network Floor Plans
Meraki Documentation
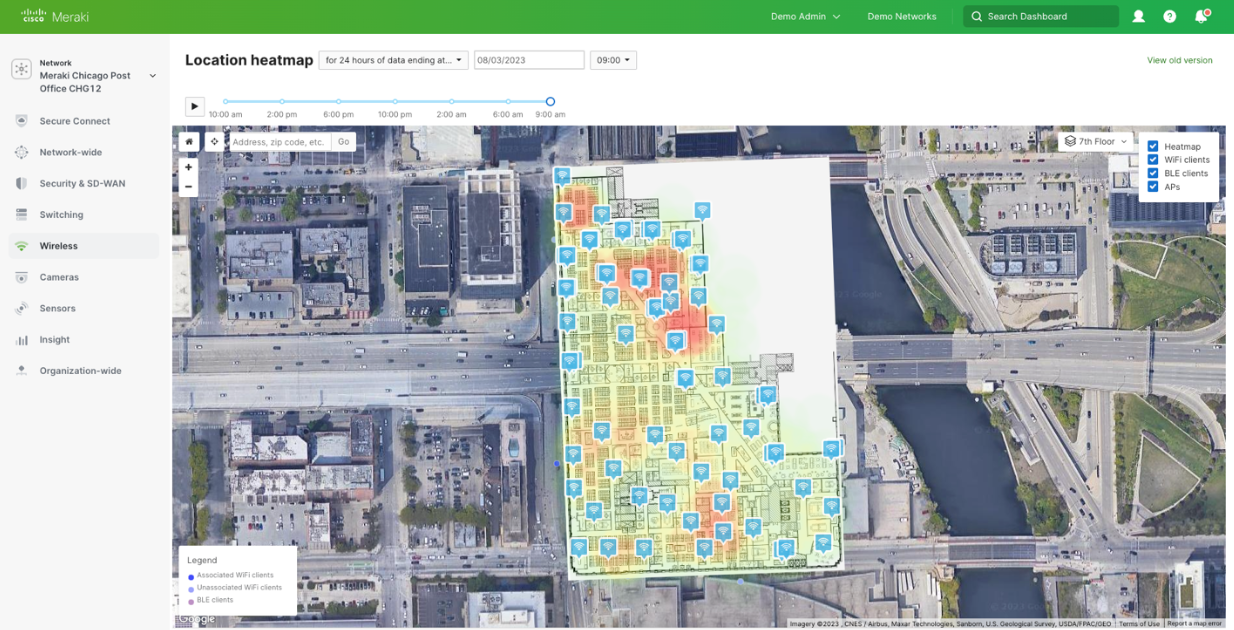
Network Map Placement, Scaling, and Alignment
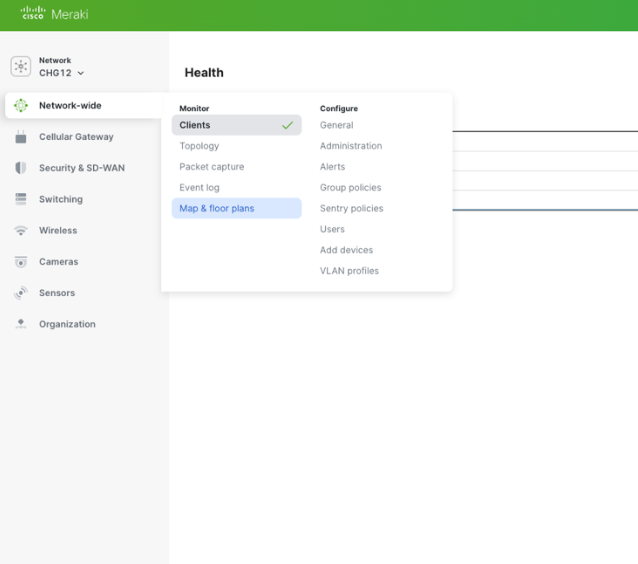
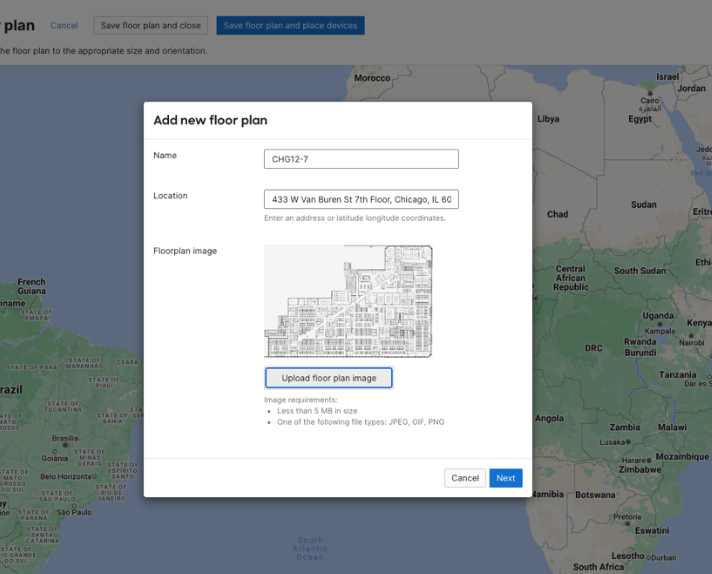
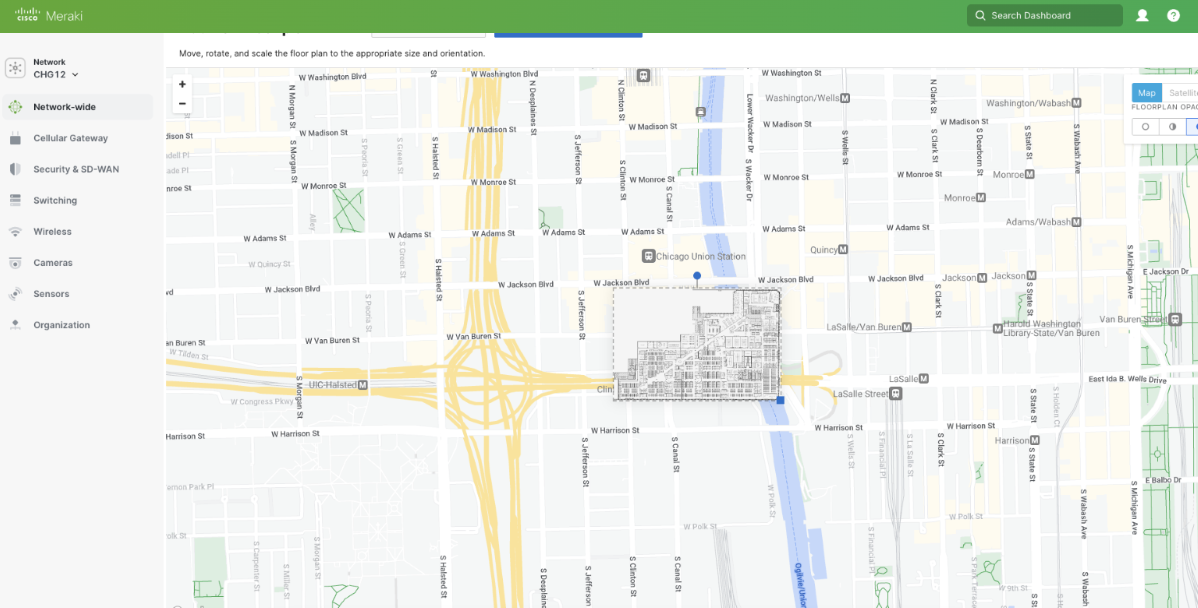
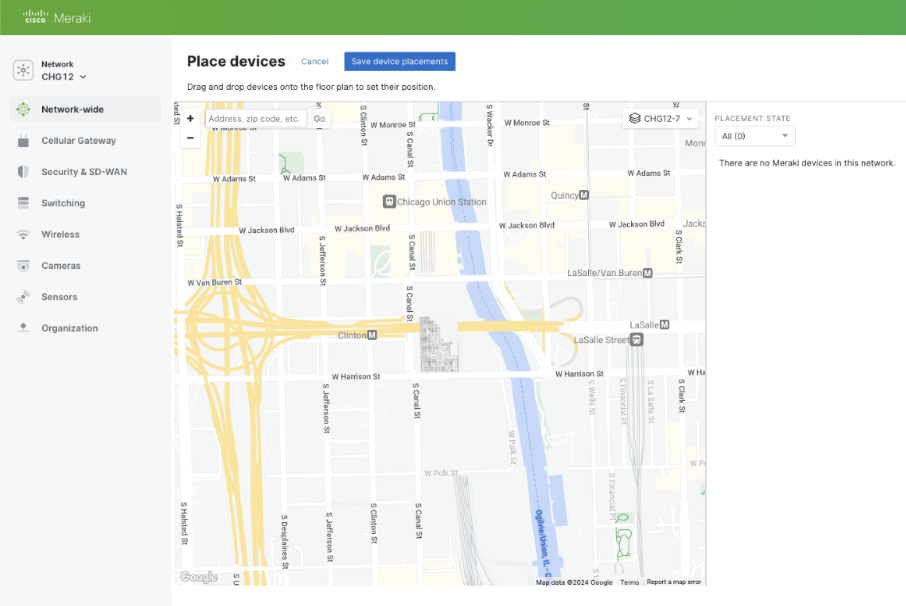
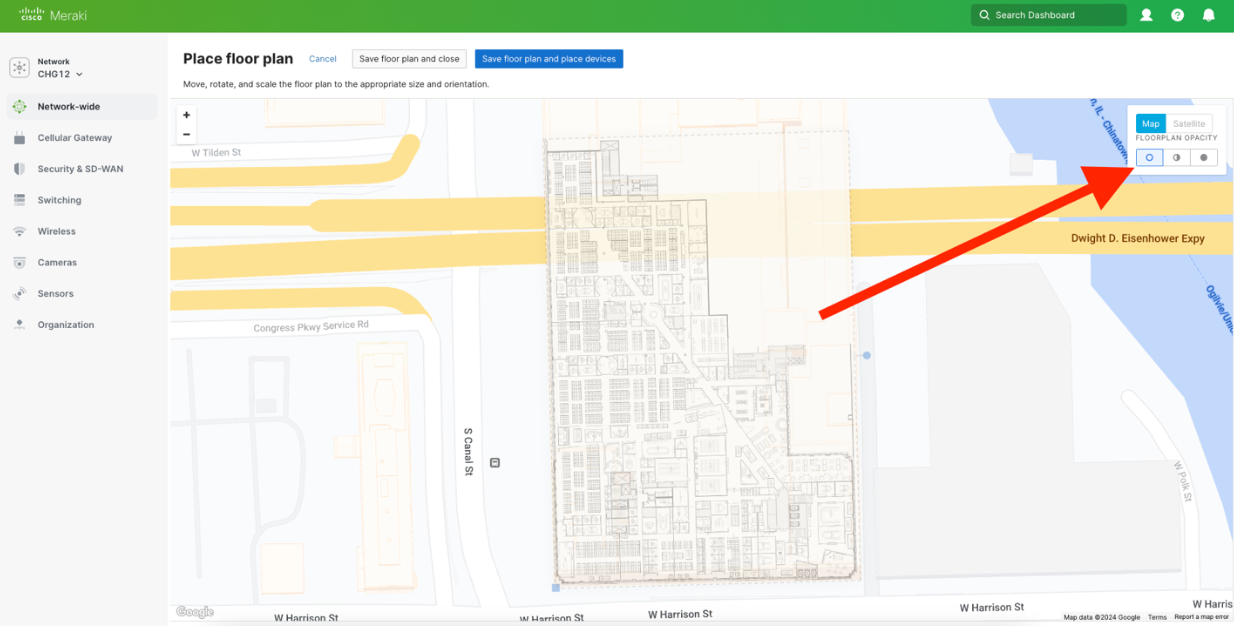
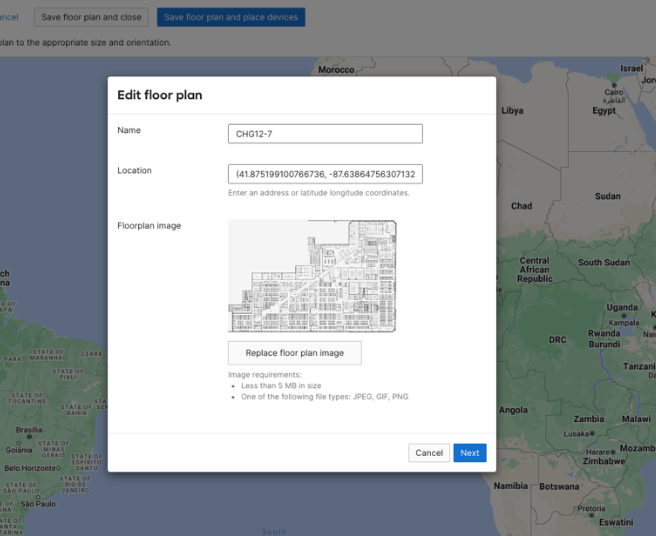
The most common occurrence among Meraki Dashboard network map deployments is proper placement, scaling, and alignment of the network map image file on the Meraki Dashboard. To upload a network map image file, click on a network, then hover over “Network-wide”, and click on “Map & floor plans”. If the network floor plans have already been added, then click on “Edit” on each of the floors on the right side of the map view one-by-one to correct their placement, scaling, and alignment. Add a new floor plan by clicking on “Add a new floor plan” on the top of the map view.
https://app.vidcast.io/share/f1faa92d-66e3-4da1-be78-0b6ec79e9123